Project
AI
SAAS
Desktop
Overview
Computer vision platform detecting model mistakes and blindspots.
Task
Build the platform and supporting visual language, lead all design initiatives, collaborate closely with all engineers.
Outcome
- $1 million in revenue for the first year.
- 5 new clients.
- Consistently positive UX feedback.

Overview
Challenge
Building a platform to detect issues and blind spots in AI models came with a steep learning curve, requiring a deep dive to truly understand the domain. Clear and frequent communication with the team was crucial.
Vision And Strategy
We built features by anticipating what would resonate, trusting our intuition and domain expertise. At the same time, we were confident in our ability to identify issues early and surface them clearly to users.
Core Team
[ 1 ] - Designer (Me)
[ 1 ] - Product Manager
[ 2 ] - Back End Engineers
[ 3 ] - Front End Engineers
[ 8 ] - Machine Learning Engineers
Process
How I made it work
This was the process I introduced to bring ideas to life quickly and effectively. It evolved naturally from experience and close collaboration with the people I worked with, allowing us to move fast without sacrificing quality.

Features
Explore, Discover, Debug
To support dataset exploration, we provided users with two ways to browse their data: an image grid and an embedding-based view. Users could draw selections directly on the embedding space to isolate clusters, then easily save or edit them.
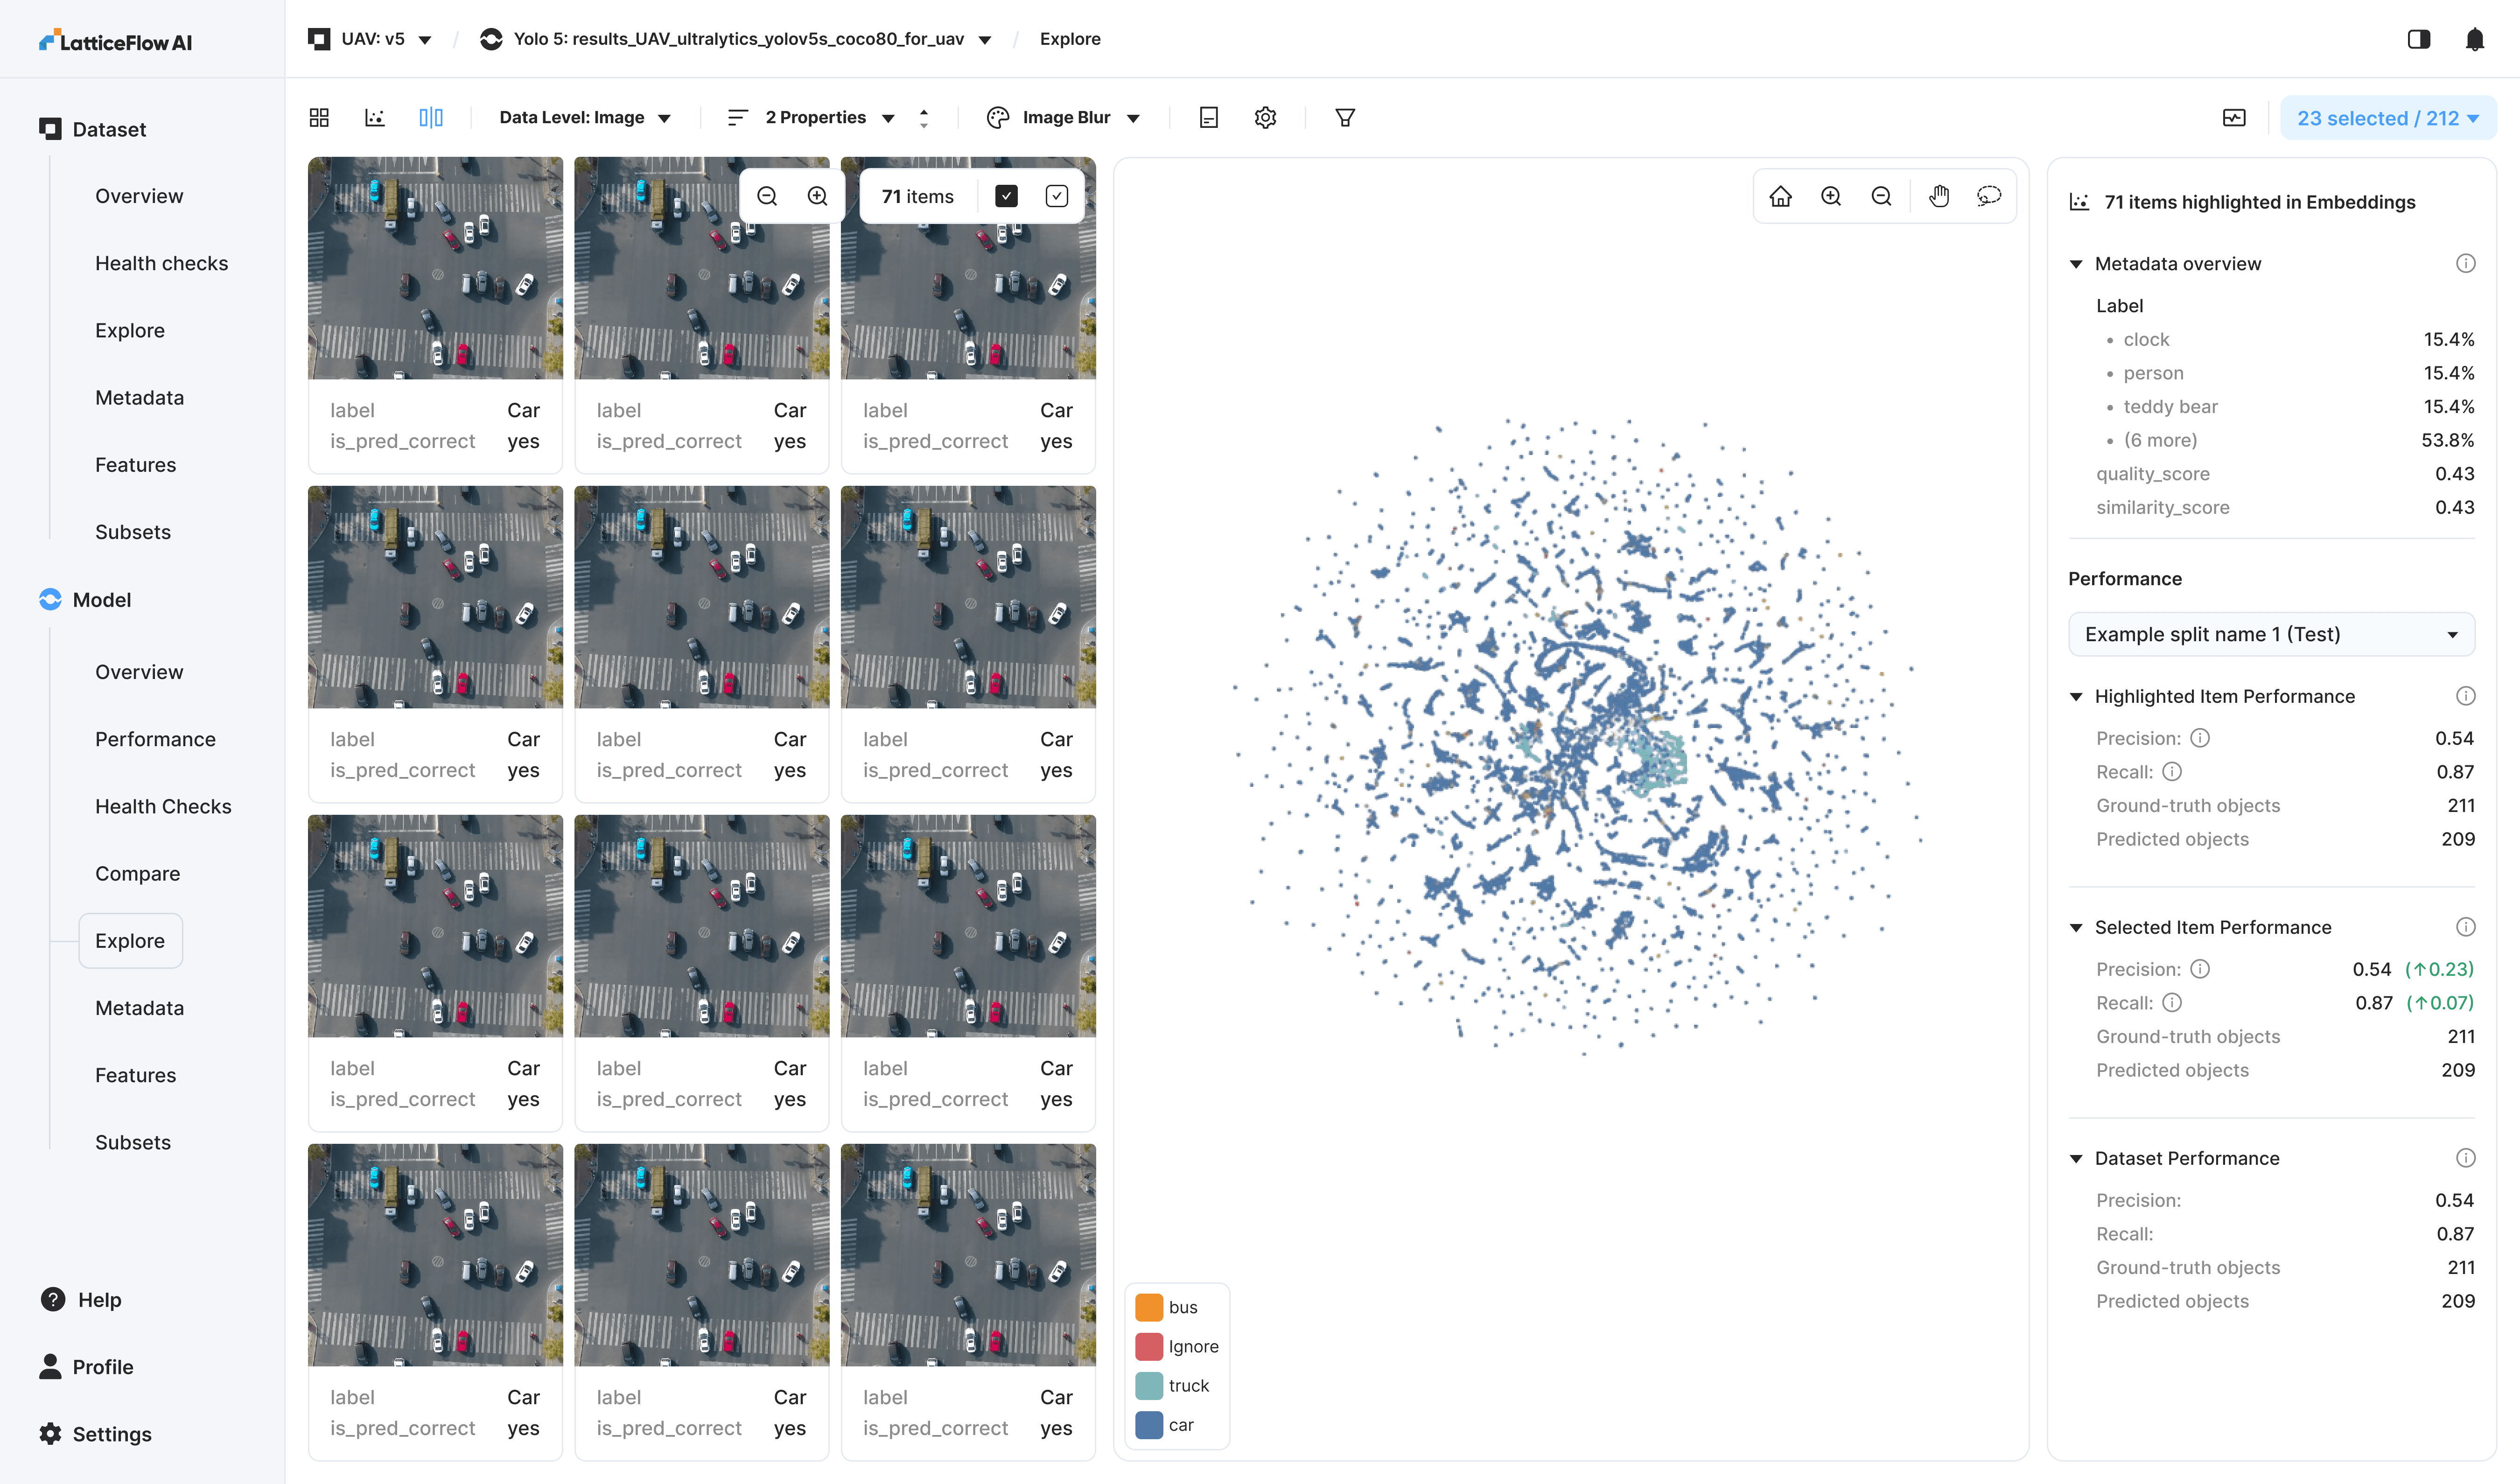
This feature provides strong product value, particularly through the contextual statistics in the right sidebar, which enable quick, clear comparisons between different selections.
Item Details
Expanded view enabling annotation updates and inspection of all supported metadata attributes and associated scores.
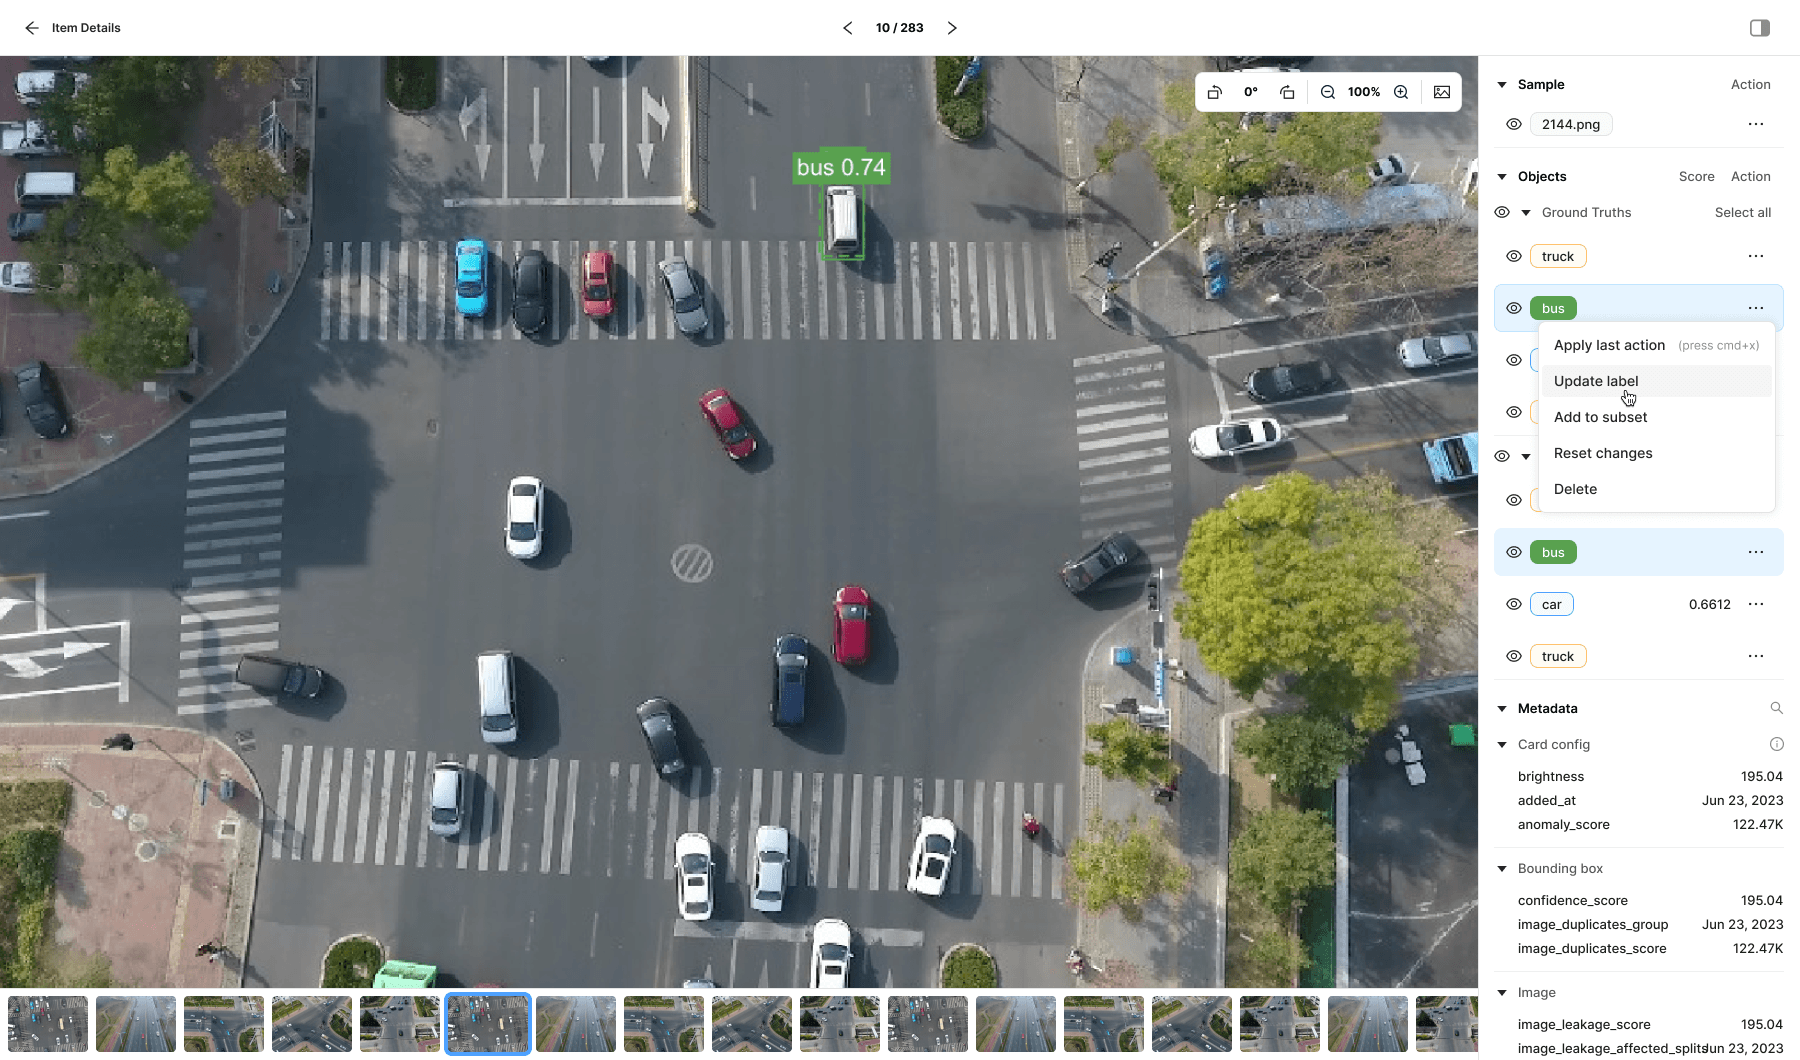
While inspecting an item, I needed a way to edit bounding boxes without breaking focus. To address this, I introduced a Layers panel inspired by familiar tools like Photoshop and Figma. The panel follows established layer-management patterns while extending them with additional, task-specific controls tailored to this workflow.
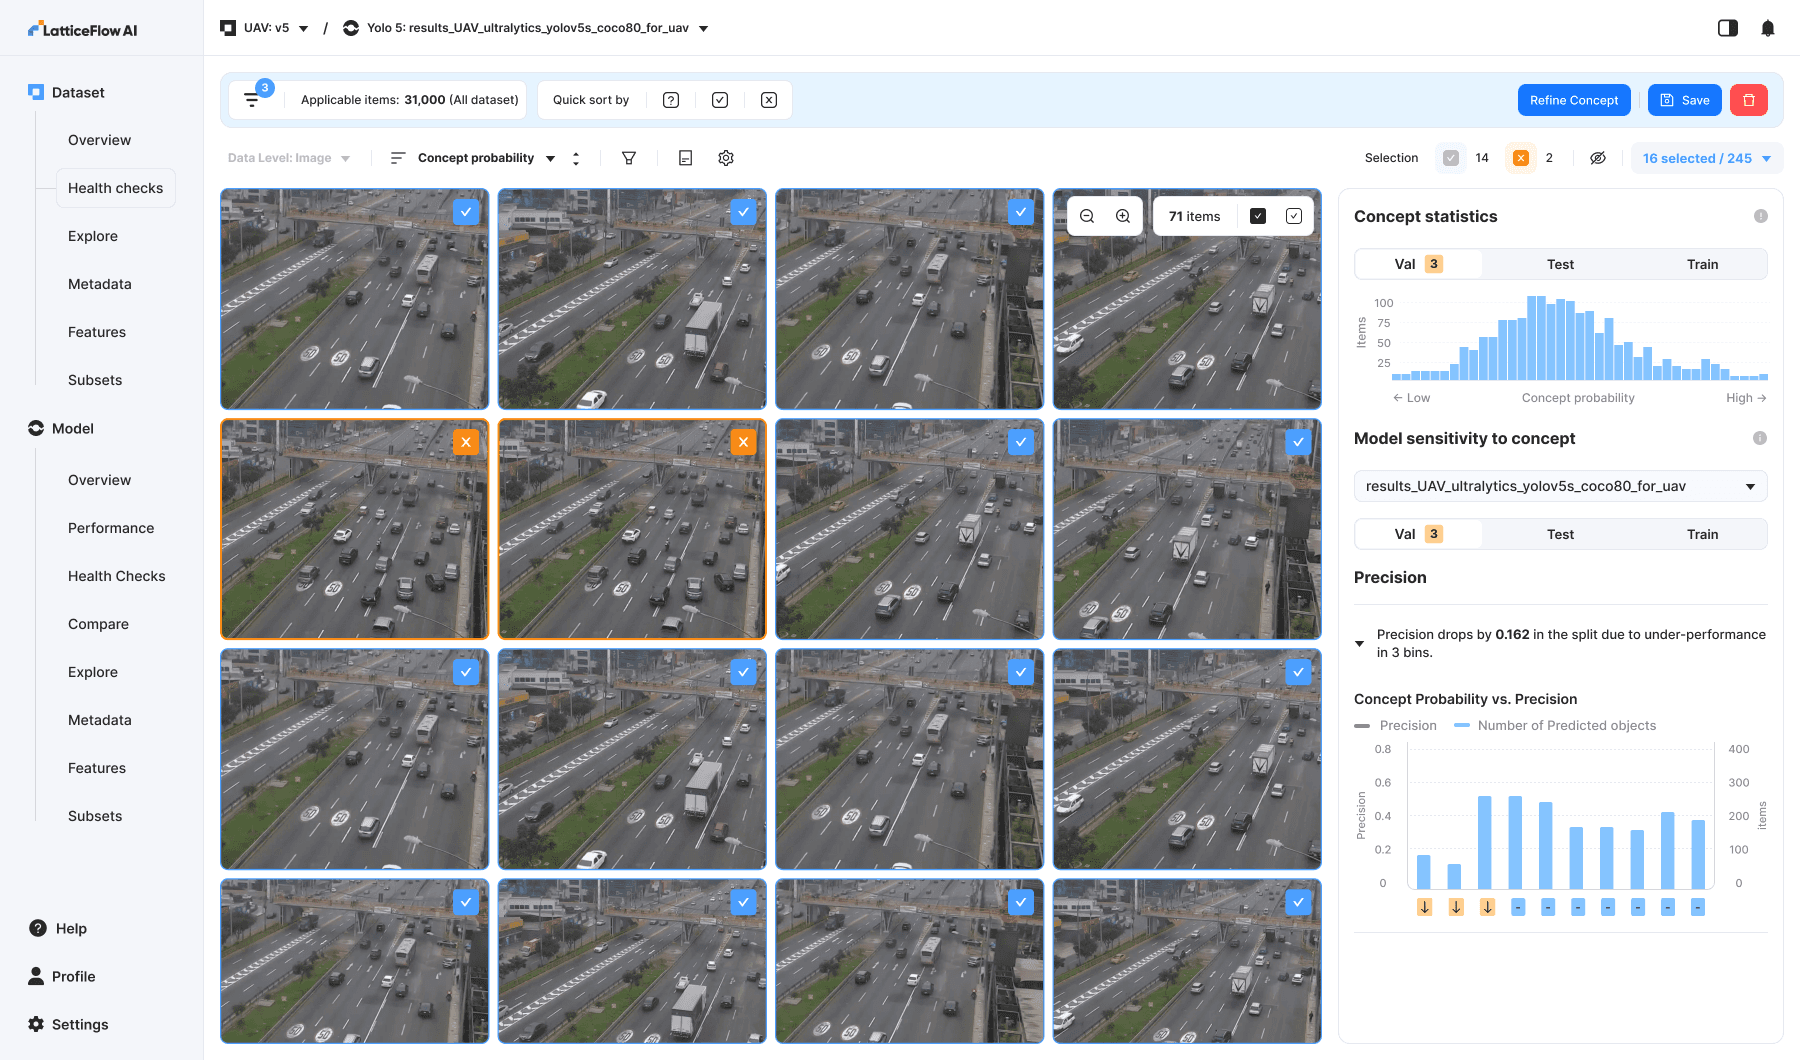
Concepts
Concepts were the most widely adopted feature among users. By defining positive and negative examples, users could efficiently probe model behavior under specific conditions.
For example, to evaluate performance on pictures with trucks, users would provide images containing trucks as positive examples and pictures without trucks as negative examples. By guiding the classifier toward pictures with trucks, users can easily test how well the model performs in that specific scenario.
Item Details Page: Selection is showing the ground truth and prediction bounding boxes.
Health Checks
Health checks automatically evaluate image data and model behavior to catch issues like performance drops, bias, drift, and robustness gaps—helping teams spot risks early and keep vision models reliable in production.
Model Sensitivity to Metadata
Model sensitivity to metadata health checks are specific automated evaluations that test how a model’s performance changes across different metadata categories — such as image brightness, sensor type, or user-defined attributes — to detect blind spots, biases or underperformance linked to those metadata factors. These checks help uncover whether the model behaves inconsistently or poorly for specific metadata groups compared to others.
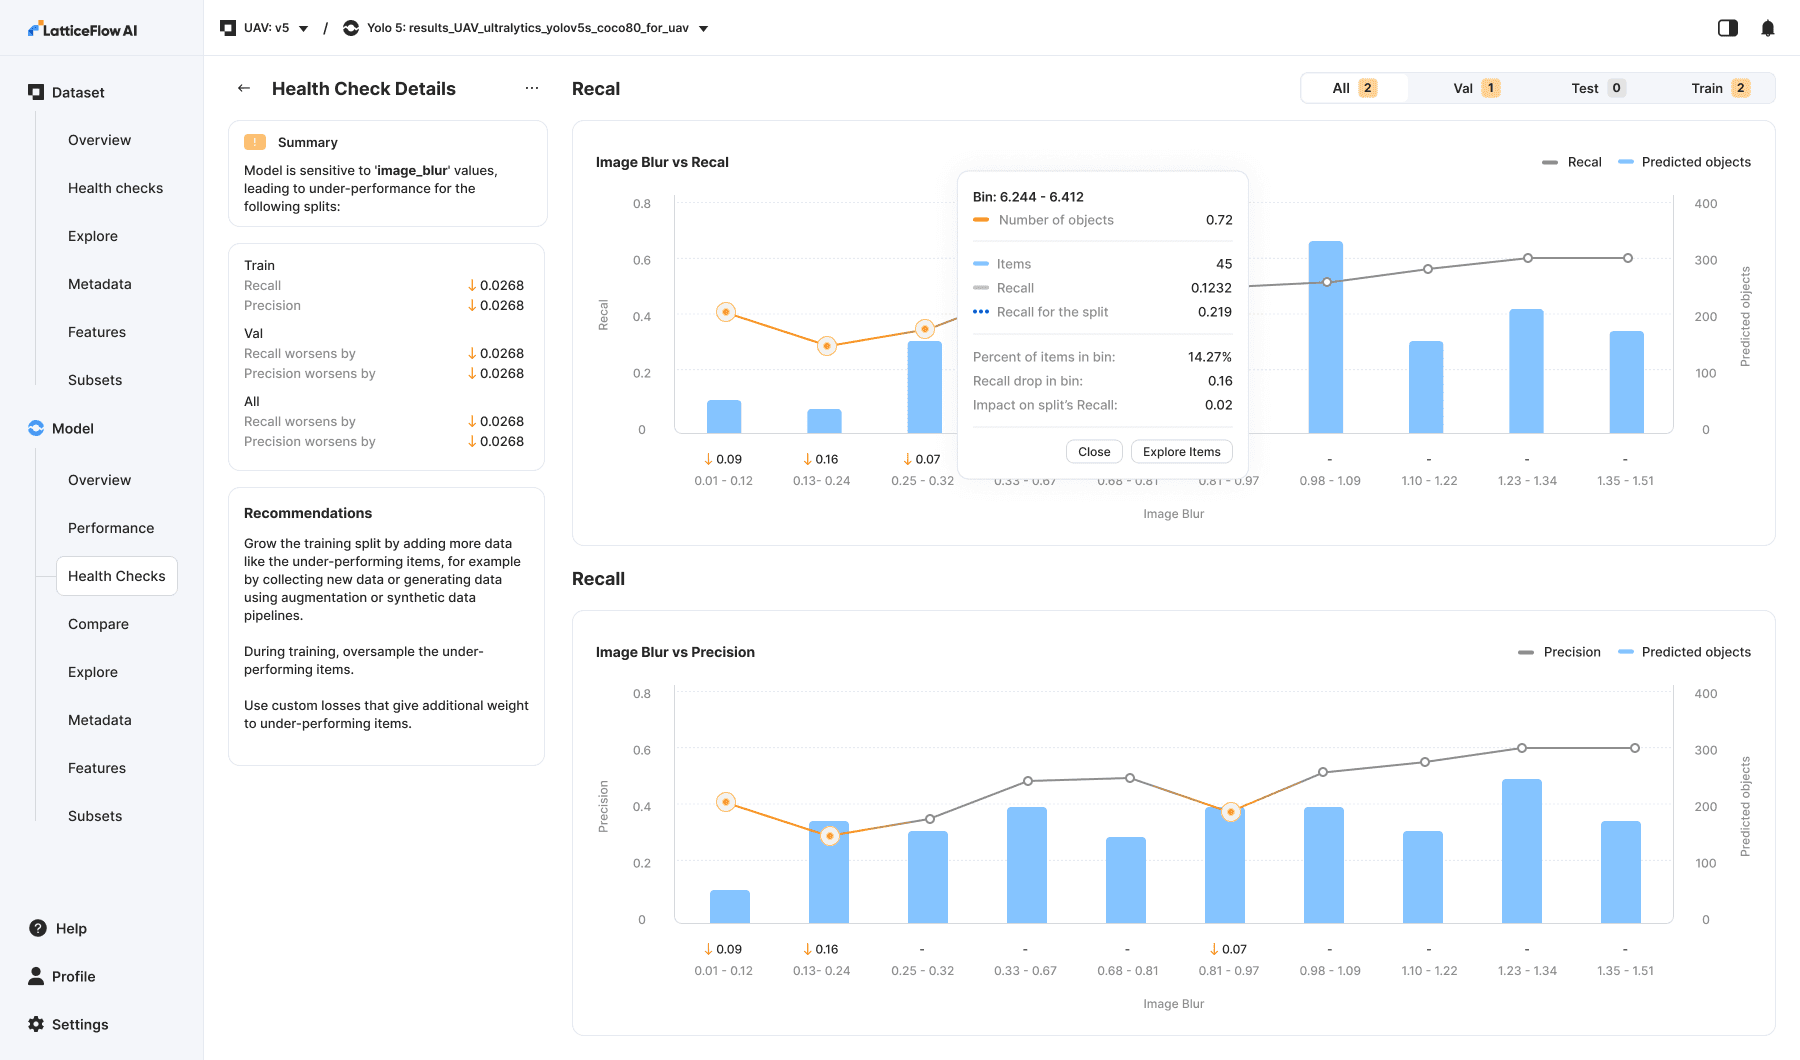
One of the most powerful tools in the product. Through automated checks, users can quickly identify samples with the largest performance drops (highlighted in orange). By clicking a blue bar, they are taken directly to Explore, where they can immediately preview and investigate those samples and take further action.
Model Comparison
Providing a way to test before-and-after model performance was essential. This feature delivers much deeper insight into model comparisons and offers a quick, intuitive way to explore classes and clusters.
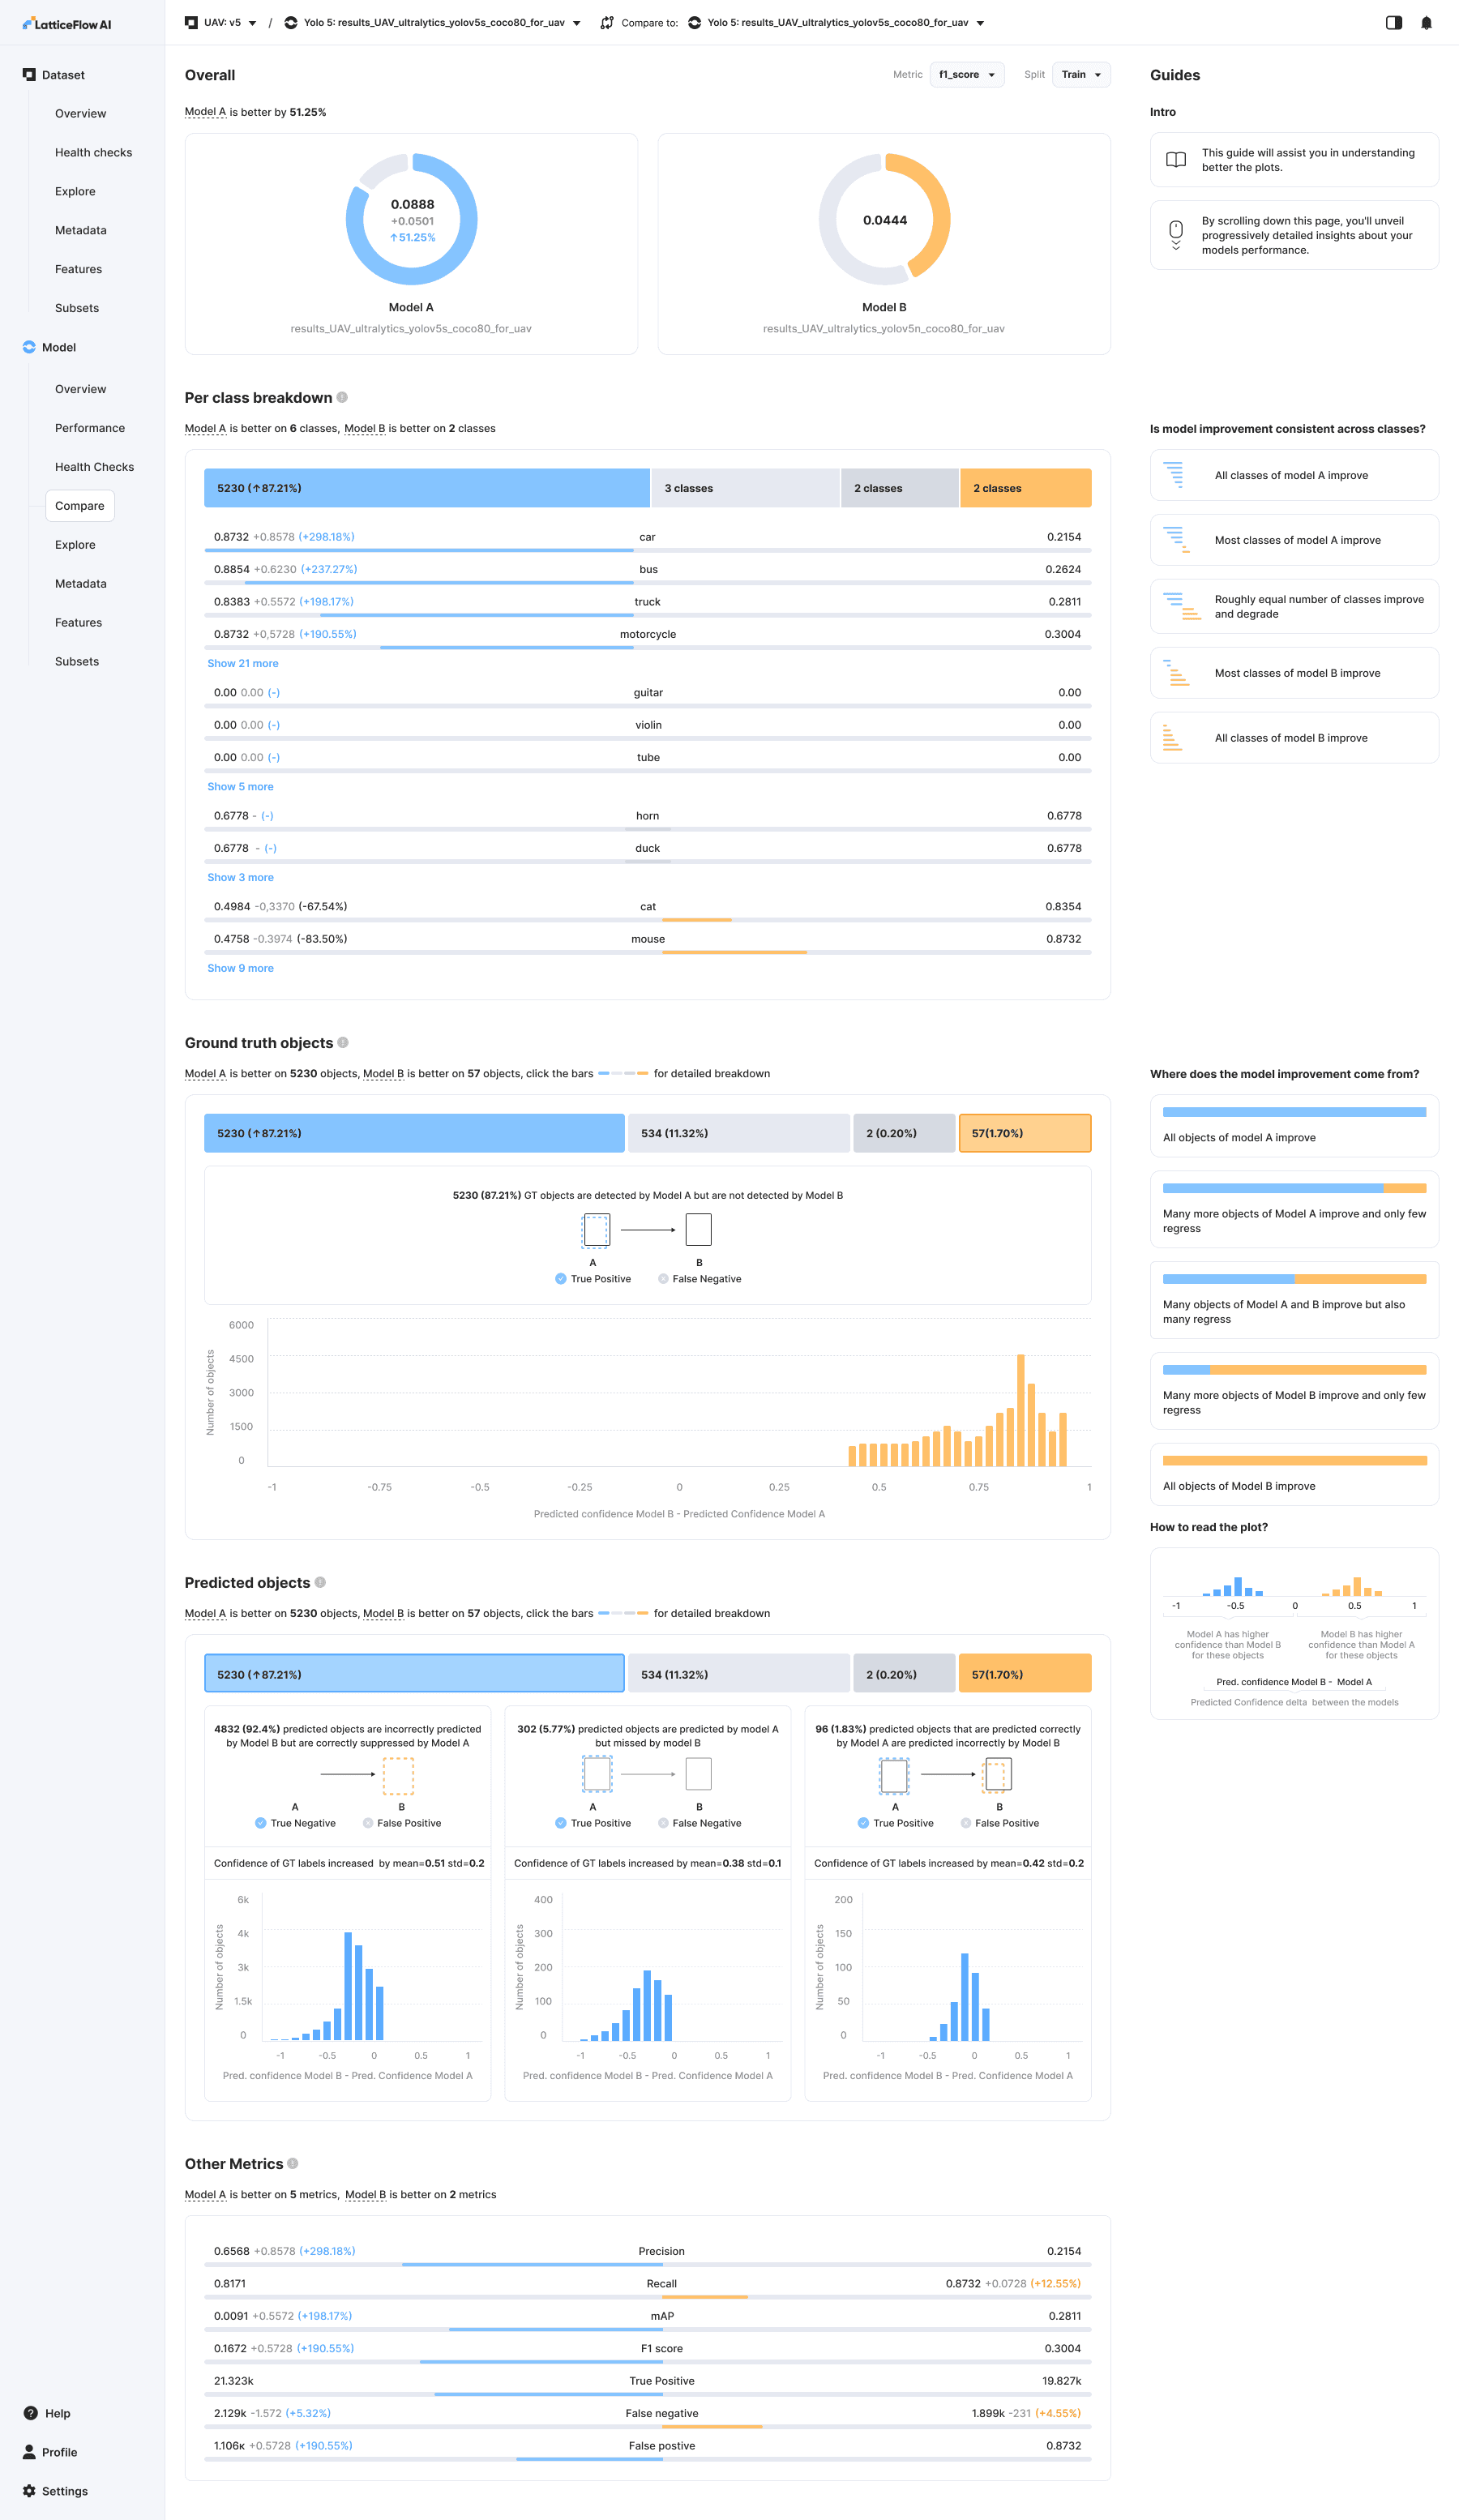
Model Comparison: Comparing two versions A and B of a object detection model.
Outcome
Results
- $1 million in revenue for the first year.
- 5 new clients.
- Increased task completion rates by 50%.
- Consistently positive UX feedback.
Learnings
Know your users. User testing showed that our primary audience machine learning engineers and leads are highly technical, detail-oriented users. They actively explore interfaces and read supporting information in full. Based on this behavior, we prioritized rapid release and in-product validation over extensive external testing.
User validation alone isn’t enough. Features that users say they want may still see low adoption or deliver less value in practice.


Utility -> Usefulness -> Looks
2026